Web forms, without denial, are an indispensable part of your business. They help you grow your email lists, accept payments, track delivery and billing information, and above all, interact with your potential leads.
From a marketing perspective, web forms serve as the lifeblood of increasing conversion. Apart from paying attention to the form design, tracking form analytics and analyzing user interaction matter a lot to improve your overall conversion.
In this article, we will list the 7 best form analytics tools in 2021 that help you better understand and optimize your form performance. First off, we will be spelling out the importance of form analytics and some key form metrics you should know when analyzing form data.
Let’s get started!
- Why is Form Analytics Important?
- Key Form Metrics You Should Know
- Zuko
- Hotjar
- Decibel Insight
- Lucky Orange
- Clicktale
- Mouseflow
- Inspectlet
Why is Form Analytics Important?
Form Analytics refers to form measurement activities helping to understand how users interact with your forms. These activities include tracking form data and analyzing form metrics.
For instance, you can track how many people complete/drop off your forms, which field takes users most time to finish, and which forms on your site get a high conversion rate.
Form Analytics is crucial as it gives you a clear picture of how your forms are performing and optimizing them for generating more leads and conversions.
The first and obvious benefit is it helps reduce the form of abandonment, which we’ll show you how in the next part. Secondly, Form Analytics enables you to understand different user behaviors, from which you can build segmental email marketing lists. Asides from that, it also contributes to classifying your target audiences, which is useful in expanding a promotion plan accordingly.
Since you’ve known how important Form Analytics is, we’ll introduce several key form metrics you should know when analyzing form data.
Key Form Metrics You Should Know
- Conversion rate: how many users start to fill in your form vs how many of them actually complete and submit it?
- Field order: whether visitors type in forms in the order that you laid out?
- Form abandonment: which form fields cause users to abandon the forms.
- Time report: how long users take to complete each field or the whole form.
- Ignore fields: which fields visitors ignore before they submit the forms.
These essential form metrics can help you find out your up-to-scratch form analytics tools. Now, it’s time to take a look at our top 7 form analytics recommendations!
Zuko
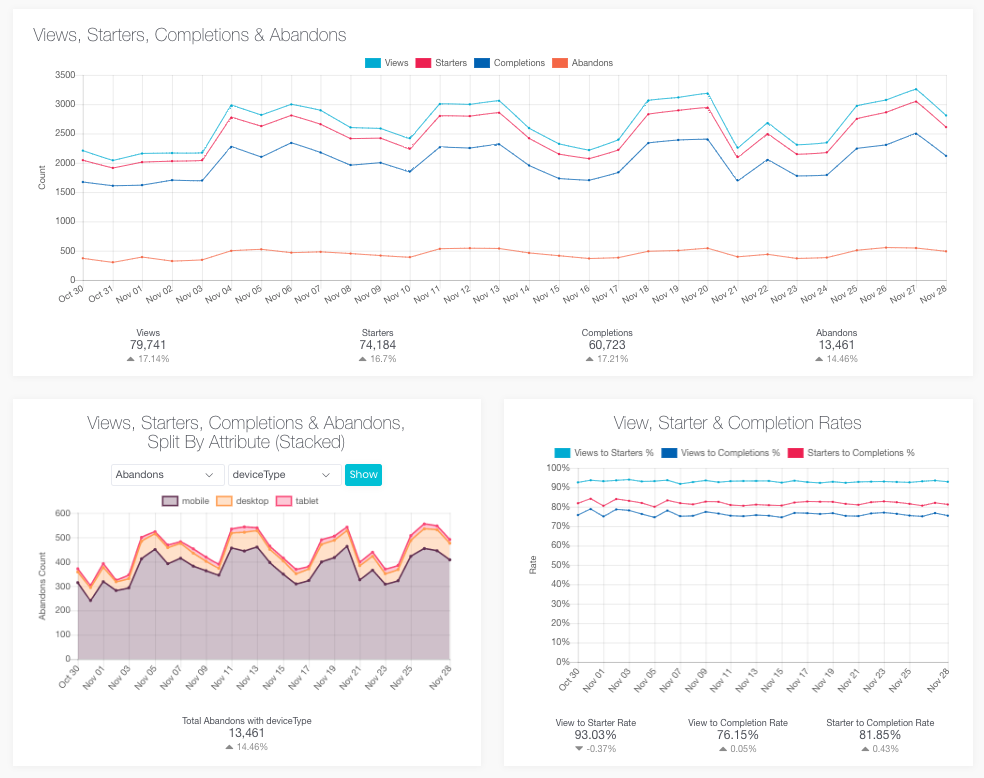
This powerful and flexible tool aims to measure the “micro-interaction” of users when they complete online forms and checkout processes. Zuko is designed to handle all types of forms, from simple app forms to multiple checkout forms. This cloud-based form analytics tool offers striking features, including:
- Form data view: view form traffic and completions in a particular period, see metric comparisons, and average completion time.
- Field level metrics: see the most abandoned fields, how long users spend on each field.
- Individual journeys: filter sessions based on form completion or abandonment, track patterns of user behaviors through sessions, and identify user journeys via your forms.
- Custom dashboard: allow segment comparisons and moving between metrics quickly.
- Form behavior settings: alerts real-time issues or an unusual spike or drop in the form metrics, create email lists for different users from various forms and alerts.
- Event and attribute tracking: track error messages related to form abandonment.
Though Zuko boasts a lot of ideal features, its user interface is the main trade-off. You may need to spend time reading available tutorials to get used to it.
Price: The plan starts at £100 per month for up to 10.000 sessions. The tool also offers free trials for each plan.
Hotjar
Hotjar is another form analytics tool that allows you to track user behavior with your forms, based on visitor recordings, heatmap, conversion funnel reports, and more.
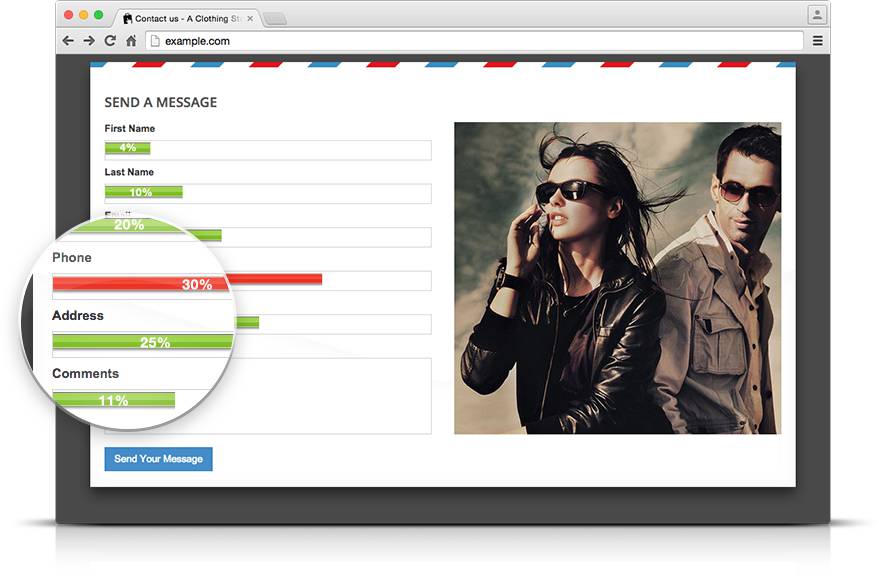
One of its major uses is the heat map feature. In a nutshell, the heatmap displays which areas of your web page receive more attention by using different levels of colors. The brighter, the more attention.
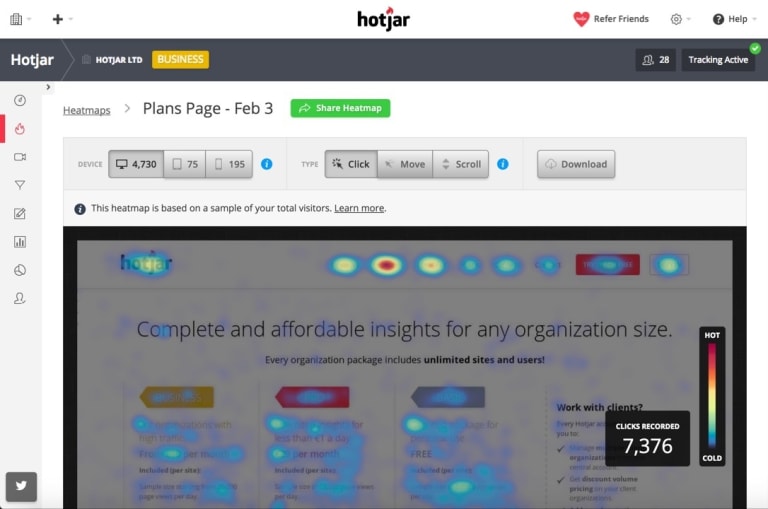
Hotjar’s heatmap explains how users click and scroll on your form. Beyond clicks, this form analytics tool also displays the mouse movement and the number of clicks on the same places right in the dashboard.
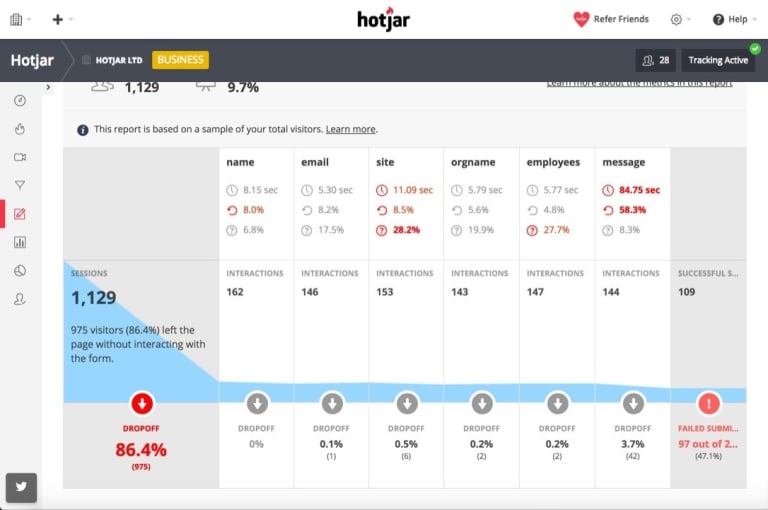
On the side of form reports, you can see the numbers of users who start filling your forms, the average time users spend on each field, or completing the whole form. It also reveals which fields cause users to drop off your forms and how many failed submissions you get.
Although Hotjar wows you with its ease of use and intuitive user interface, the tool has some downsides as well.
It doesn’t let you separate the data by date or week ranges. What’s more, its integration and export options are quite limited. The tool only allows integration with HubSpot, Optimizely, and Omiconvert.
Price: The basic plan of Hotjar is free. Other paid plans are based on the number of sessions, which starts from $39/month.
Decibel Insight
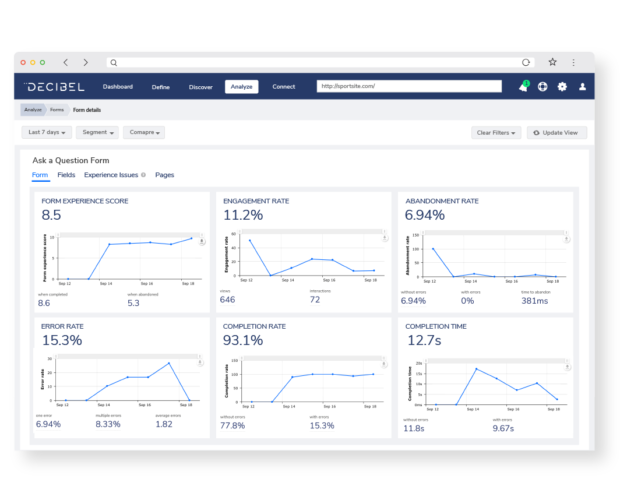
This form analytics tool allows you to not only measure the traffic performance of the whole site but the individual user interaction with your forms. It quickly collects user data and identifies which fields lead to the most abandonment rate. Using Decibel Insight will enable you to get the insight into:
- The numbers of people who see your forms and who start to fill them out.
- The percentage of users who abandon/complete your forms with and without errors.
- The average time it takes users to complete your forms with and without errors.
Decibel Insight possesses a unique feature called the session replay. Every session is tracked and recorded to provide you with detailed data about customer journeys. This comes in handy as you can go back to watch the form interaction and figure out what you should change to improve your form conversion rate.
Its intuitive and straightforward interface receives lots of praise as users can easily find the information they look for in a heartbeat. The only downside of this tool is its limitation on stat displaying options. Top-level stats should be presented in various visual ways, i.e pie charts, graphs. In addition, it would be great if the tool could export charts and graphs instead of just the CSV files.
Price: There is no free plan for this tool, however, you can request a demo to get familiar with how it works. The tool offers the quote-based plan, therefore the pricing detail isn’t published. You need to contact the vendor to ask for the actual price. (We’re told it’s no less than $400.)
Lucky Orange
Lucky Orange is one of the most powerful form analytics tools to track user interaction with your forms. It seems an ideal pick for anyone who wants diverse options, accurate analysis, a user-friendly interface, and above all, a low price.
Like many other tools, Lucky Orange includes the heatmap tracking clicks and mouse movements on your forms. In terms of form analytics, the tool offers 4 main types of reports:
- Time to start: this report will show you the average time visitors take to start filling out your forms.
- Field time: it identifies which fields take users the longest time to complete. From there, you can consider removing them or change them to optional.
- Abandonment: this report points out the last field users type in before they drop off the form. For the fields causing a high percentage of abandonment, you can adjust whether to cut them off or change their labels.
- Repeated fields: the report shows you the accurate data of the fields corrected the most by the same users.
- Order: the Order report helps you understand if customers complete the field in the order you have arranged or not. This enables you to rearrange the fields to match their orders, which increases the form submission rate.
Price: The tool doesn’t offer a free plan, which is the only downfall. After a 7-day trial, you have to choose a paid plan starting from $10 per month, which is quite reasonable.
Clicktale

Clicktale is not only a form analytics tool but a complete analytics suite that presents in-depth traffic analytics and conversion reports for your whole site.
Form Analytics is an integral part of this user-friendly tool and you can find it in the conversion section. The tool provides useful feedback about how many visitors interact with your forms and how many of those failed to complete them successfully.
Like other tools, Clicktale offers many kinds of form reports, including:
- Time report: how long users take to fill out each field and the entire form.
- Blank field report: highlight the field users ignore before submitting forms.
- Refill report: mark which fields users type in incorrectly.
A key benefit if you go for Clicktale is the tool allows you to pinpoint problems, such as client-side validation or Javascript errors thanks to its replay session feature. What’s more, it helps you optimize your forms by pointing out some unnecessary words or fields and suggesting an adequate replacement for a better form completion rate.
Price: No information about pricing or packages provided on its website. As far as we know, the tool offers a free but feature-limited plan. For more advanced features, you need to opt for the paid ones, which start from $99 per month. (The price based on the number of visitors you want to track).
It seems not an ideal option for anyone just to look for a form analytics solution, however, for users wanting a versatile platform, Clicktale is worth considering.
Mouseflow
Mouseflow gives you real-time data about visitors, form drop-off, blank submissions, refills, timing, and potential form issues. This form analytics tool provides detailed information about form traffic and any inconveniences that users may be facing with each particular part of the forms.
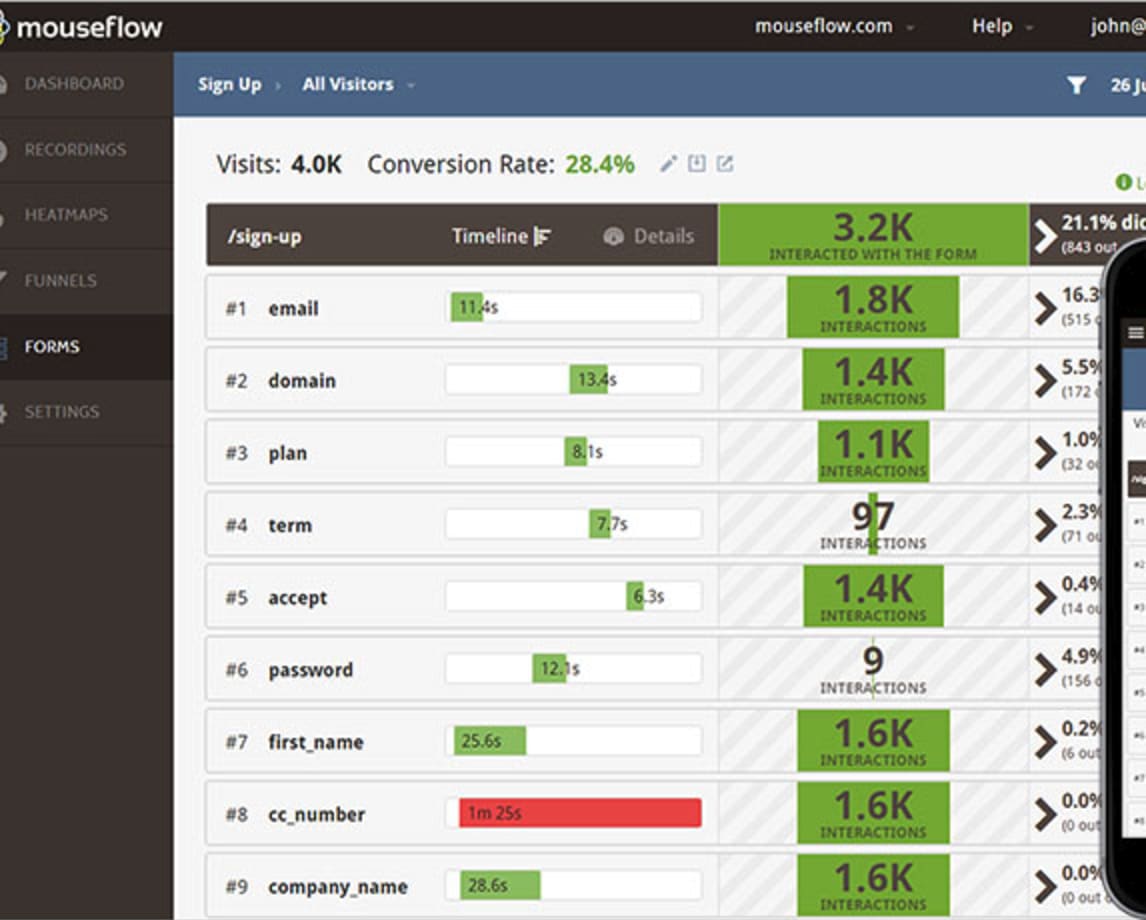
By recording the form interaction, Mouseflow can bring forward several handy tips to help eliminate the irrational points. For example, it highlights which sections of your form attract more eyeballs and which do not, or why leads hesitate to sign up for free trials. This considerably contributes to improving user experience, as well as increasing conversion.
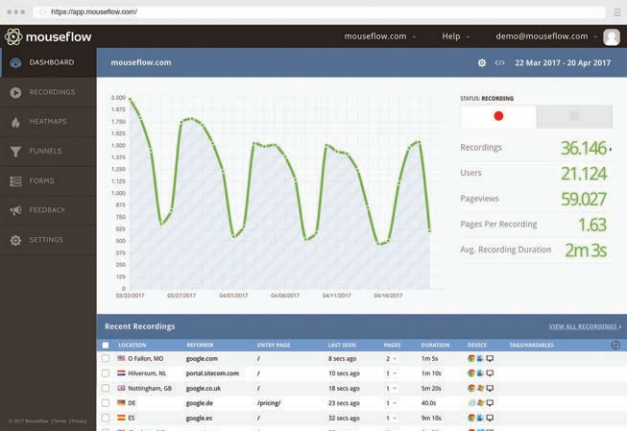
One big advantage of Mouseflow is its to-the-point dashboard. Overall, the tool offers an easy-to-follow dashboard, in which important analytics is presented in visual charts and graphics. All features and settings are aligned on the left side of the dashboard. With just one click and users can easily switch to different features and get access to diverse essential data.
Surprisingly, given its popularity, Mouseflow doesn’t have an app version for Android or iOS. The form analytics feature is included in all packages, even in the free plan. However, the choices for form reports are quite restricted.
Price: Besides a free plan, Mouseflow offers premium packages that start from $24/month. You can get started with a 14-day-trial.
Inspectlet
The last form analytics tool, as well as the main competitor of Mouseflow, is Inspectlet. They are often compared due to some similarities in functionality. Like Mouseflow, Inspectlet records user sessions, heatmap, and especially form analytics.
For form analytics, Inspectlect lets you understand how effective your forms are in converting visitors. The funnel will give you exact numbers on how many visitors make it through a specific stage of the conversion process.
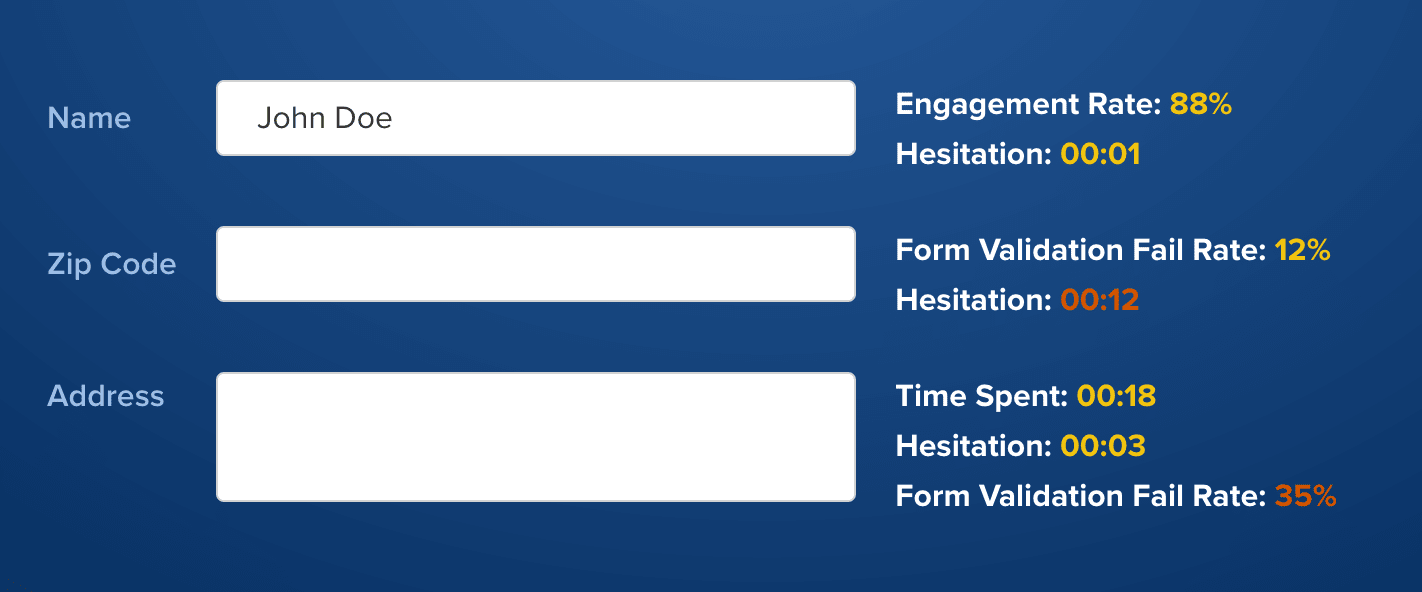
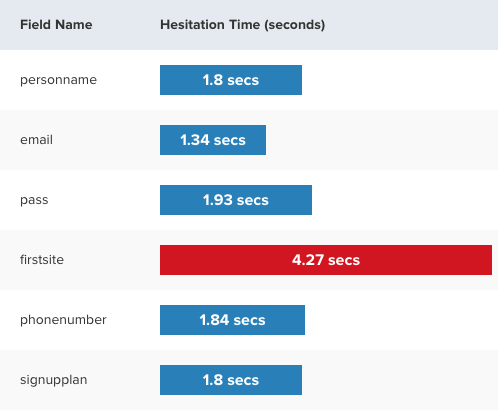
You can get a clear insight into the average time users hesitate when inputting fields thanks to the Hesitation report. It describes anything related to user hesitation, including time spent on understanding the questions or thinking about what to fill in. On top of that, its unique hesitation algorithm keeps track of and filters signals that help report whether users are engaging or hesitating.
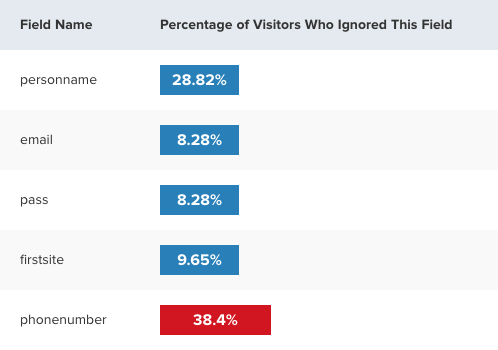
Besides, the tool also tells you which fields have a high percentage of refill because of errors and confusion. Several reasons behind this are put forward, such as validation errors often occur, users get confused by the input meaning, or required information is not appropriate. Last but not least, you will know which fields lead to a high form abandonment rate in the Ignored Field Report.
Inspectlet has an easy setup and a straightforward UI. The mere downfall of this tool lies in its high cost. The free plan is packed with limited features, even in-depth form analytics is also available for premium users.
Price: There are 6 plans for you to decide, ranges from $0-$499 per month.
Our Recommendation
This article has gone through the top 7 best form analytics tools in 2021.
All of them share similarities in analyzing your form performance and suggesting actionable tips for better conversion. The main differences arise from data reporting styles and pricing.
Choosing a useful and effective form analytics tool as your desire from our list needs a lot of time. We recommend you carefully take into account your needs, budgets, their features as well as comparing pricing and trying out a few trials before making up your mind.
Have we missed your favorite form analytics tools? Among them, which you’ve tried and satisfied the most? Feel free to mention them in the comment section below!